
Past Research
This page is some additional information about topics of research I have explored in the past.
TL;DR: I started my research career studying ozone transport in the Amazon, went on to study radar retrievals of snow and then focused on machine learning methods meteorological tasks.
Research Scientist at CSU/CIRA
2023 - 2025
As a research scientist at CSU/CIRA I worked on three primary projects: Satellite-based 3D global cloud field analysis (OVERCAST) sponsored by the Office of Naval Research; INvestigation of Convective UpdraftS (INCUS) sponsored by NASA; and a NOAA sponsored project working on AI weather forecast models.
OVERCAST
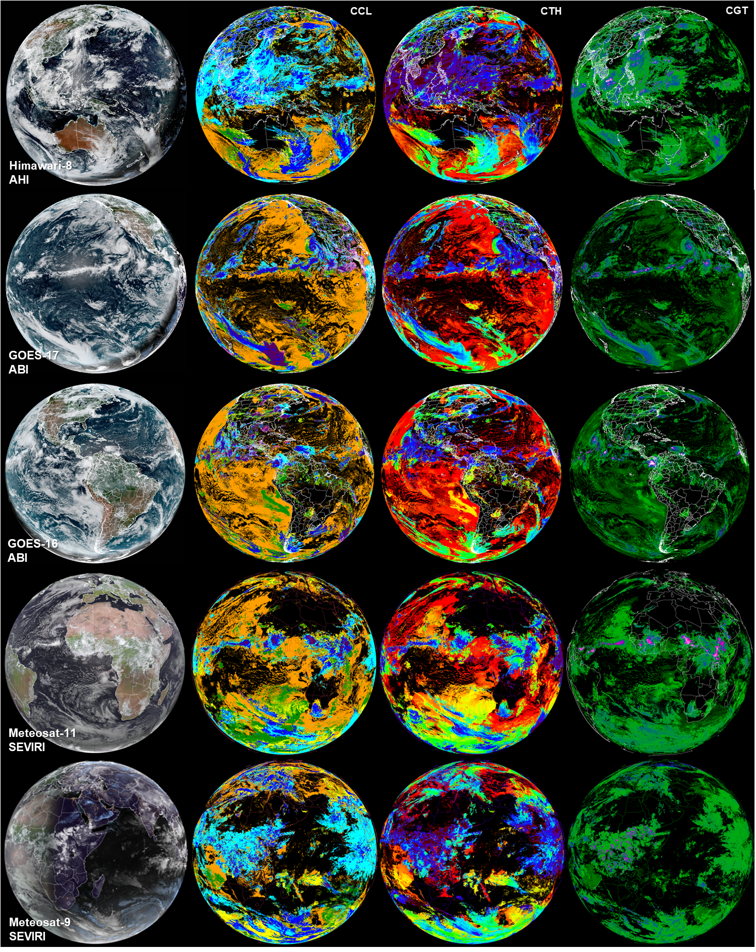
OVERCAST is a project aimed at creating a global, 3D, near real-time atmospheric cloud field analysis based on existing satellite sensors operated by a variety of agencies worldwide. We have near global coverage of meteorological satellite imagery but combining these sensors into a coherent, seamless grid of 3d clouds is a non-trivial task. A large contingent at CIRA are working on creating this product.
Diffusion Models for Nowcasting GOES Imagery
The overall OVERCAST goal is an instantaneous field of 3d clouds. This is useful but potentially more useful is a forecast of where clouds will be. There are several methods for forecasting clouds which includes: advection (based on physics models), optical flow and machine learning. I am working on the machine learning based forecasts.
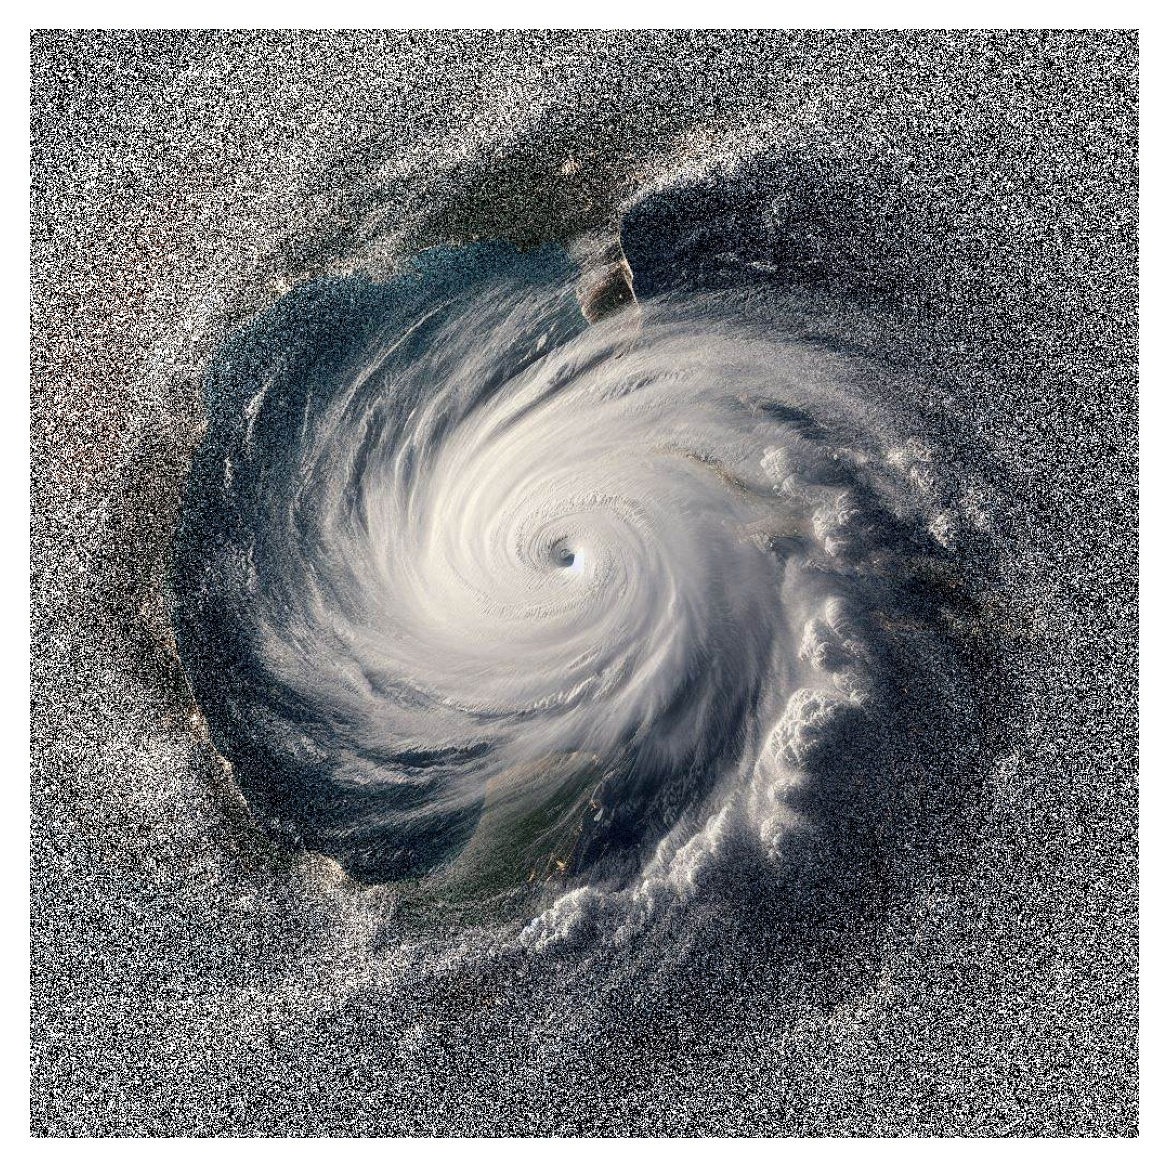 AI generate image of a hurricane with noise added
In the past few years, data-driven models (i.e., models that only use AI to do the forecast) have disrupted traditional forecasting techniques (e.g., GraphCast; GenCast; CorrDiff; StormCast). One of my goals for OVERCAST is to bring this new technology to the satellite-cloud space.
 GOES IR imagery of Hurricane Lee (2023) and noise being added to it
Over the past year, I have been mastering diffusion models, which train machine learning models to remove artificial noise from an image (see image above), teaching it how to generate data it was trained on. I’ve successfully implemented the same diffusion method as GenCast and CorrDiff on GOES-16 imagery. So far I have been able to forecast the future hour of satellite imagery, beating a plain CNN/Unet and persistence. A comparison to HRRR will come later. A paper explaining diffusion at a more digestible level and showing off these nowcasting results is being drafted and will be submitted to AIES and arXiv in the coming months.
 A diffusion model forecast of IR temperature from GOES. This 6 hour forecast only uses 2 input images (the last 20 mins) to forecast out the next 10 mins, repeated to get a 6 hour forecast. No physics is explicitly coded.
Other researchers at CIRA have adapted the method to work with synthetic microwave imagery, in painting missing IR data, turbulence diagnosis from satellite. So far, diffusion models seem to instantly improve sharpness of machine learning images, a common issue.
INCUS
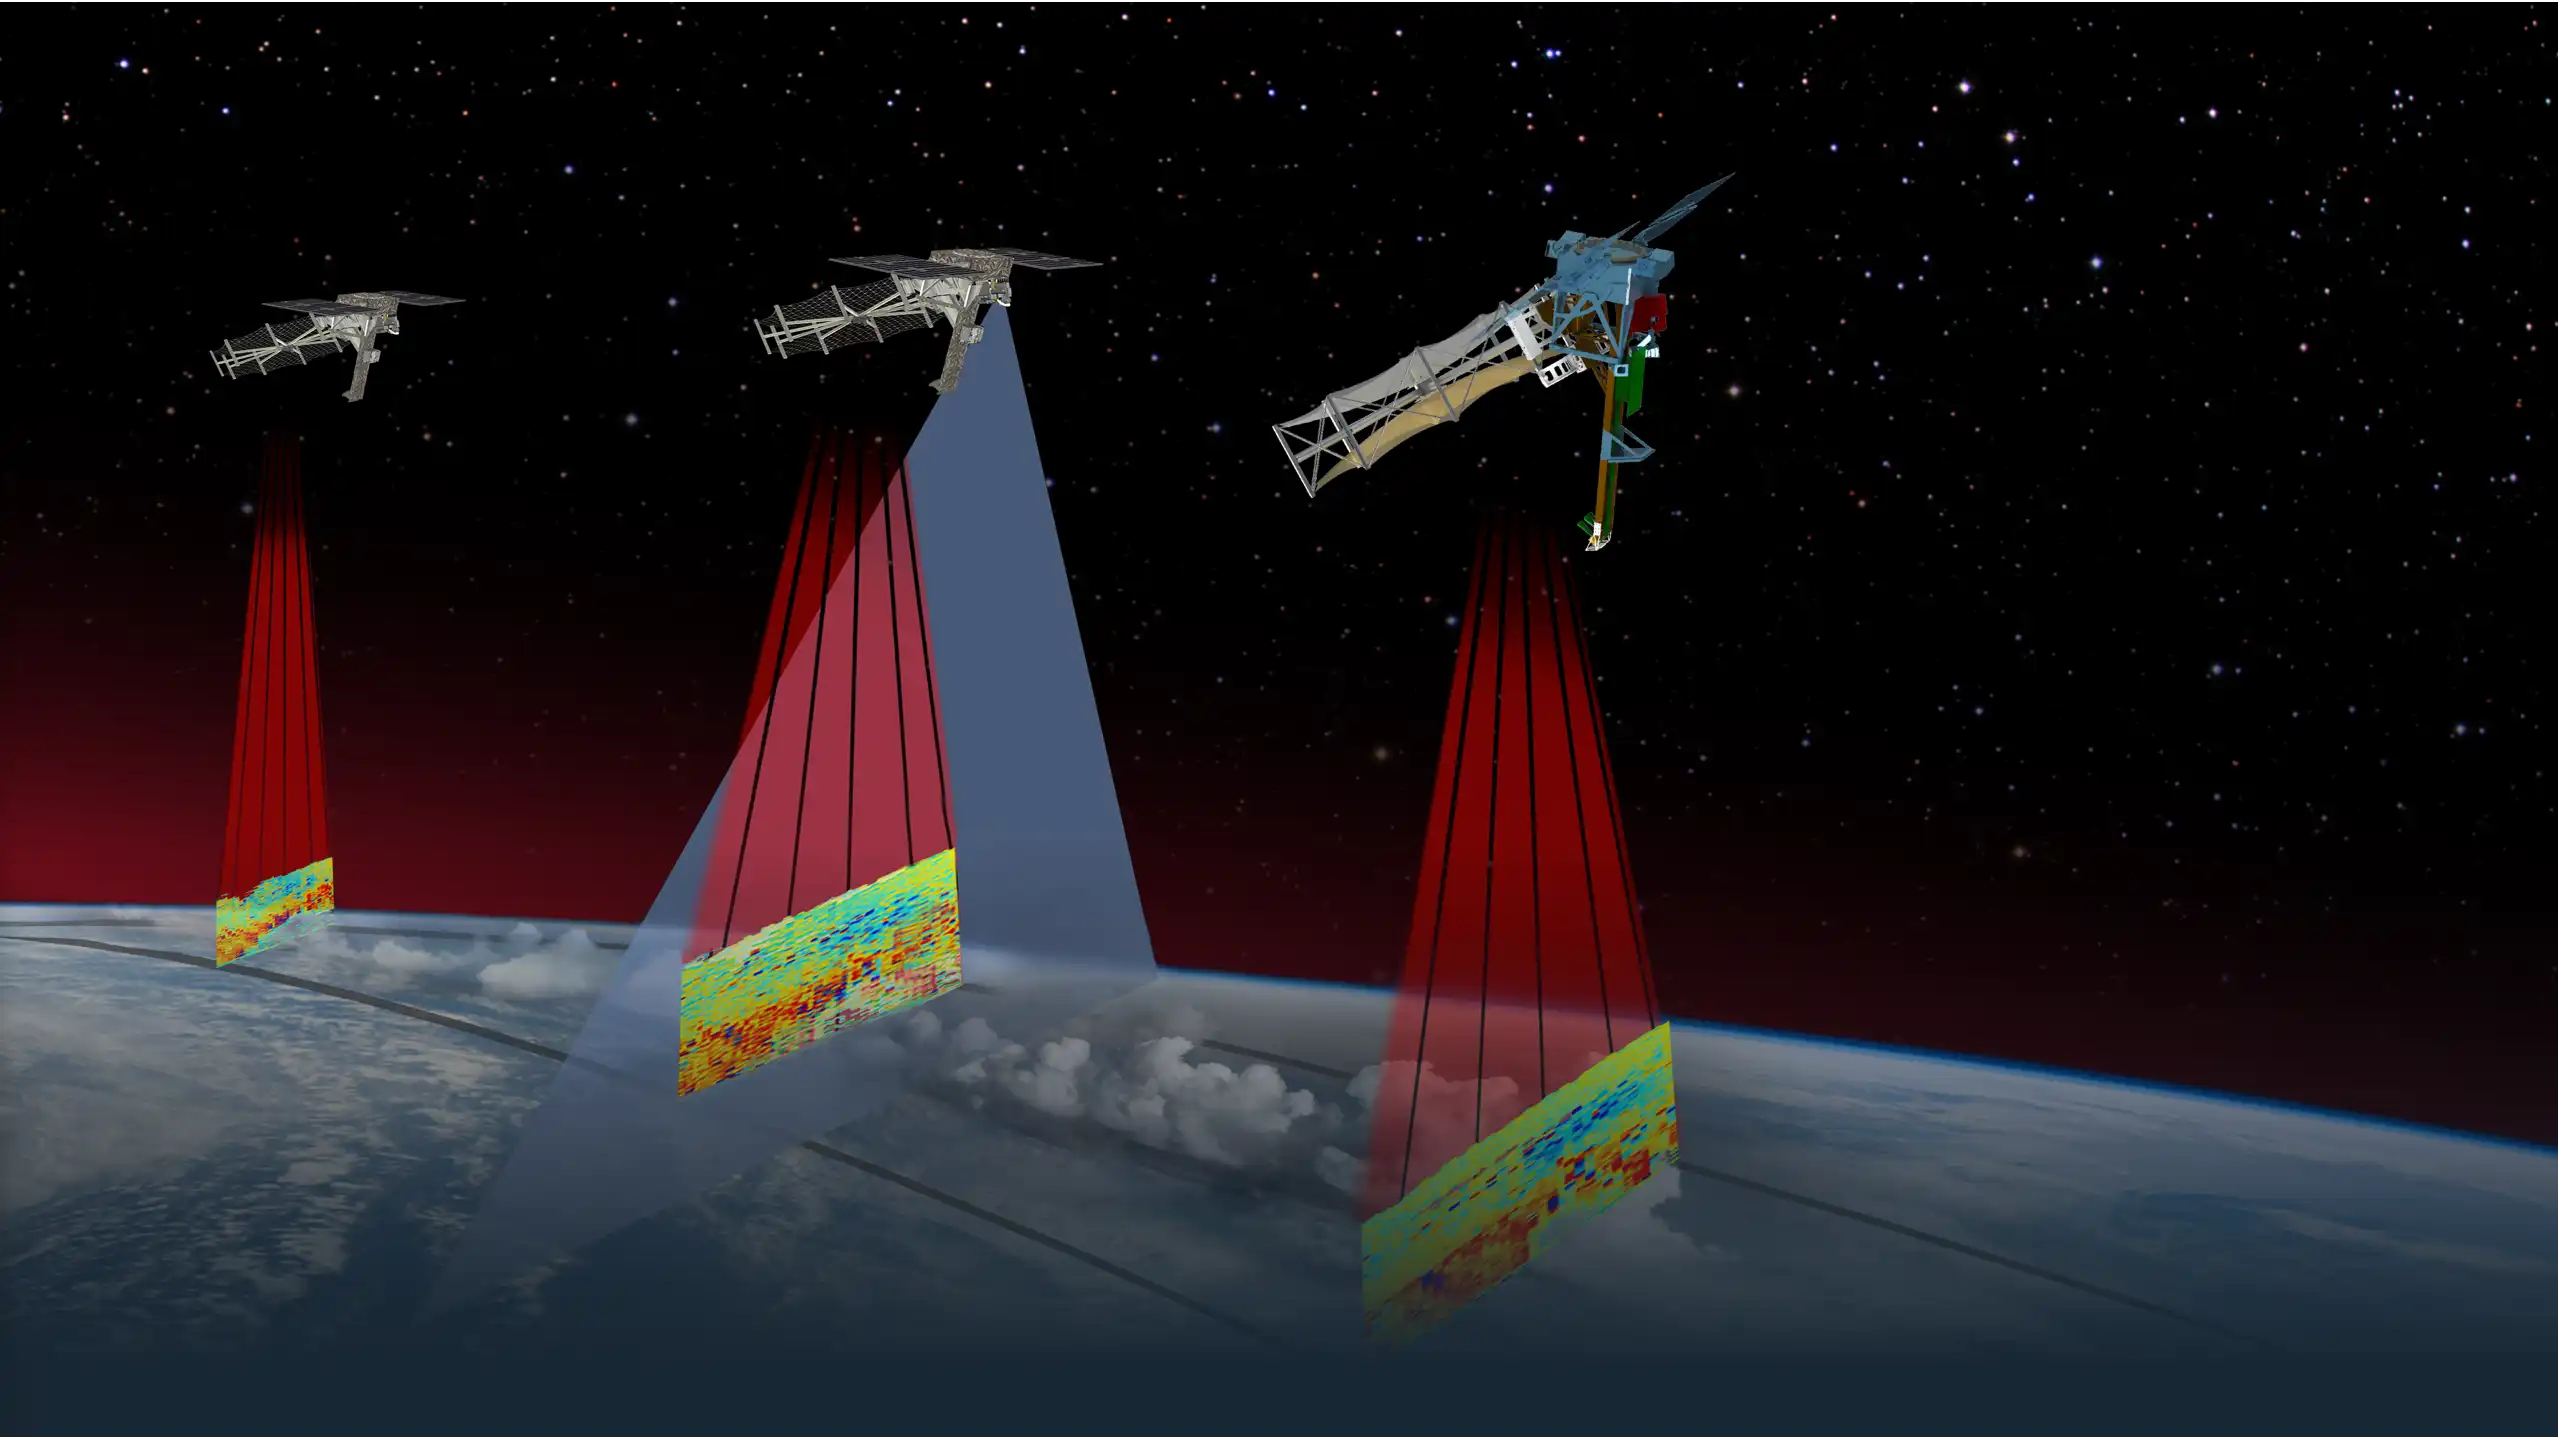 Artist rendering of the 3 INCUS spacecraft on orbit
INCUS is a NASA mission looking to quantify the convective mass flux (i.e., how much and how fast air moves) of global thunderstorms. Our physics based global weather forecasts are beginning to simulate the atmosphere at scales that can begin to resolve thunderstorms. Since this is the first time, there are no observational constraints of the spatial distribution of convective mass flux, especially over places like central Africa where storms are frequent. INCUS will measure convective mass flux using a novel spaceborne radar concept, using time differencing of 3 radars. The general idea is to see how a storms reflectivity changes, which is related to how fast the air is moving upward.
Multi-frequency observations of storms
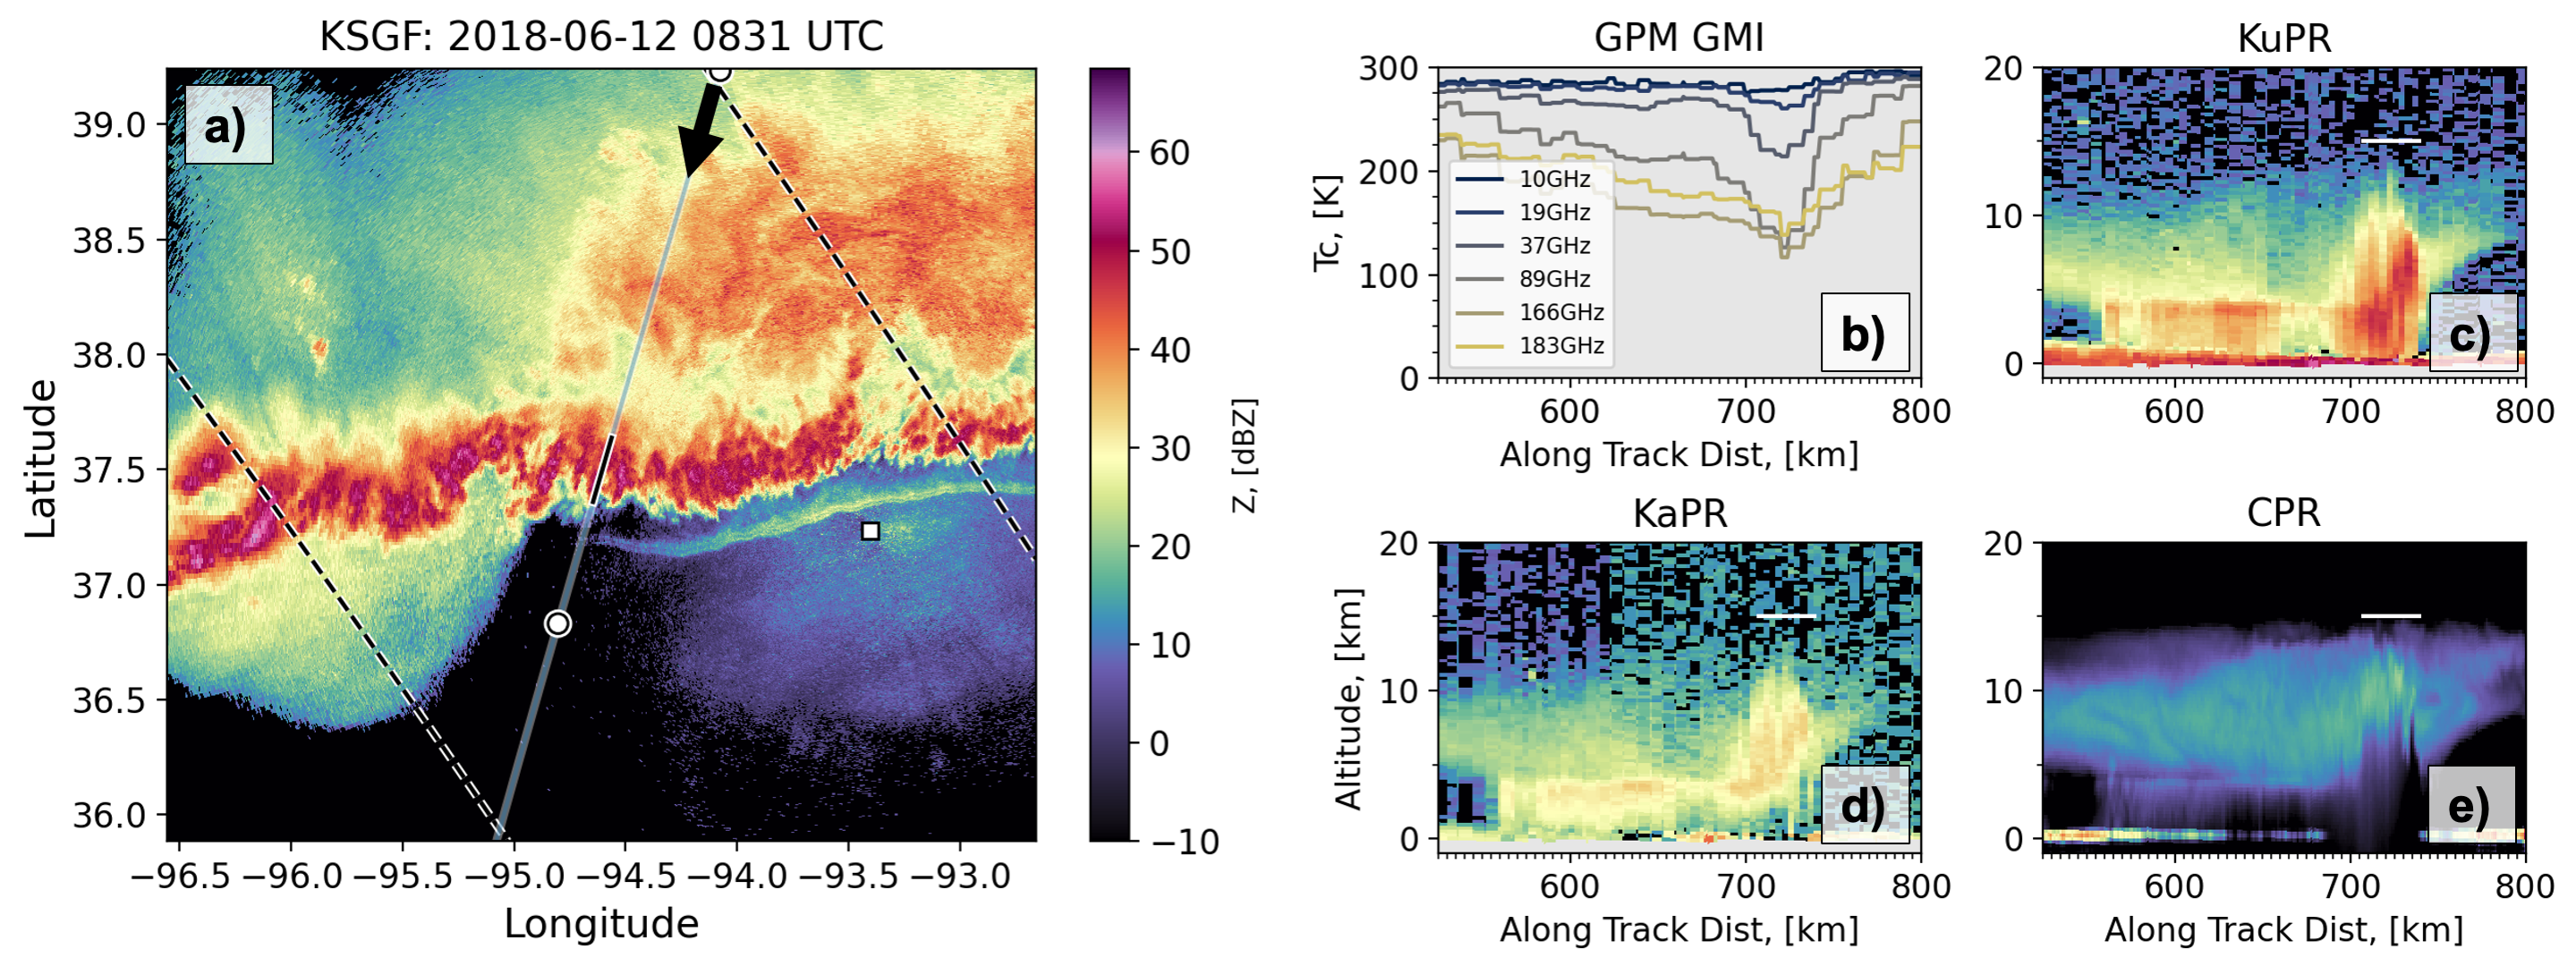 Figure 2 from Chase et al. (2024) showing an example radar sample of an MCS over the USA observed by Ku-, Ka- and W-band radars
One outstanding question as INCUS is being built is “What can we expect to see from our Ka-band (8 mm wavelength) radars within convection?”. Shorter wavelength radars (like Ka-band) tend to have added challenges with loss of signal that make retrievals from radar a bit more complicated. Unfortunately, longer wavelength radars cost more (primarily due to size), thus many missions have to choose a shorter wavelength like Ka-band or W-band (3 mm).
To help answer the question of what Ka-band will see in convection, we leverage the large database of GPM data (a Ku-, Ka-band radar) and coincidences with CloudSat (a W-band radar). We analyze the data within storms globally and show that the Ka-band performs similarly to the longer wavelength Ku-band in many aspects. Thus, the Ka-band choice shouldn’t hinder INCUS efforts when on orbit. If you want more specific details, check out our preprint Chase et al. 2024.
Machine Learning for Meteorology (Postdoc)
2021 - 2023

Machine learning within Meteorology journals has been growing at an exponetial rate.
After dabbling with machine learning for my PhD, I went on to do machine learning as the focus of my research as a postdoc at the University of Oklahoma (remotely) working with Dr. Amy McGovern. My first goal while at OU was to write two plain language
Global Precipitation Measurement mission snowfall (PhD)
2018 - 2021
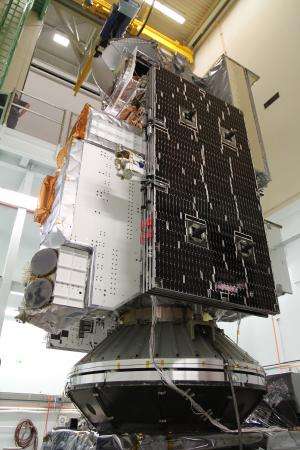
The GPM satellite preparing for launch (source)
During my masters a paper came out by Gail Skofronick-Jackson showing the Global Precipitation Measurement (GPM) mission’s estimates of snowfall globally was vastly underpredicting what CloudSat was measuring. Seeing this, my advisers and I thought it would be good to investigate why GPM’s snowfall was so much smaller than CloudSat. My PhD then can be grouped into 3 parts (and 3 papers):
1) Why is the current radar retrieval of snowfall deficient?
2) Can we create an alternate retrieval that improves snowfall estimates?
3) How well does the new alternate retrieval work compared to CloudSat?
Triple Frequency Radar Observations (MS)
2016 - 2018
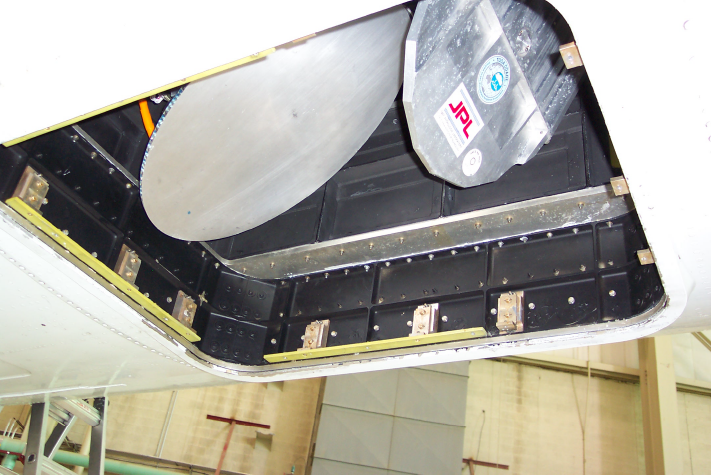 APR-2 courtesy of NASA
For my masters work, I was hired to work on analyzing NASA field campaign data that was collected for the Global Precipitation Measurement Mission. One insturment that was used during these campaigns was the Airborne Precipitation Radar (pictured above). One especially novel thing from these field camapigns was that this radar observed clouds at 3 wavelengths, all collocated. These 3 wavelengths were Ku-, Ka- and W-band. Having 3 different wavelengths helps constrain our retrievals of things like snow amounts, snow particle size etc.
This was the first time that an airborne platform used these 3 frequencies together, and previous ground based efforts showed the 3 frequencies could help determine snow habit, i.e., aggregate vs rimed particle. What I did was explore how the new airborne data compared to the ground based work, and also include some coincident in-situ observations from a second aircraft.
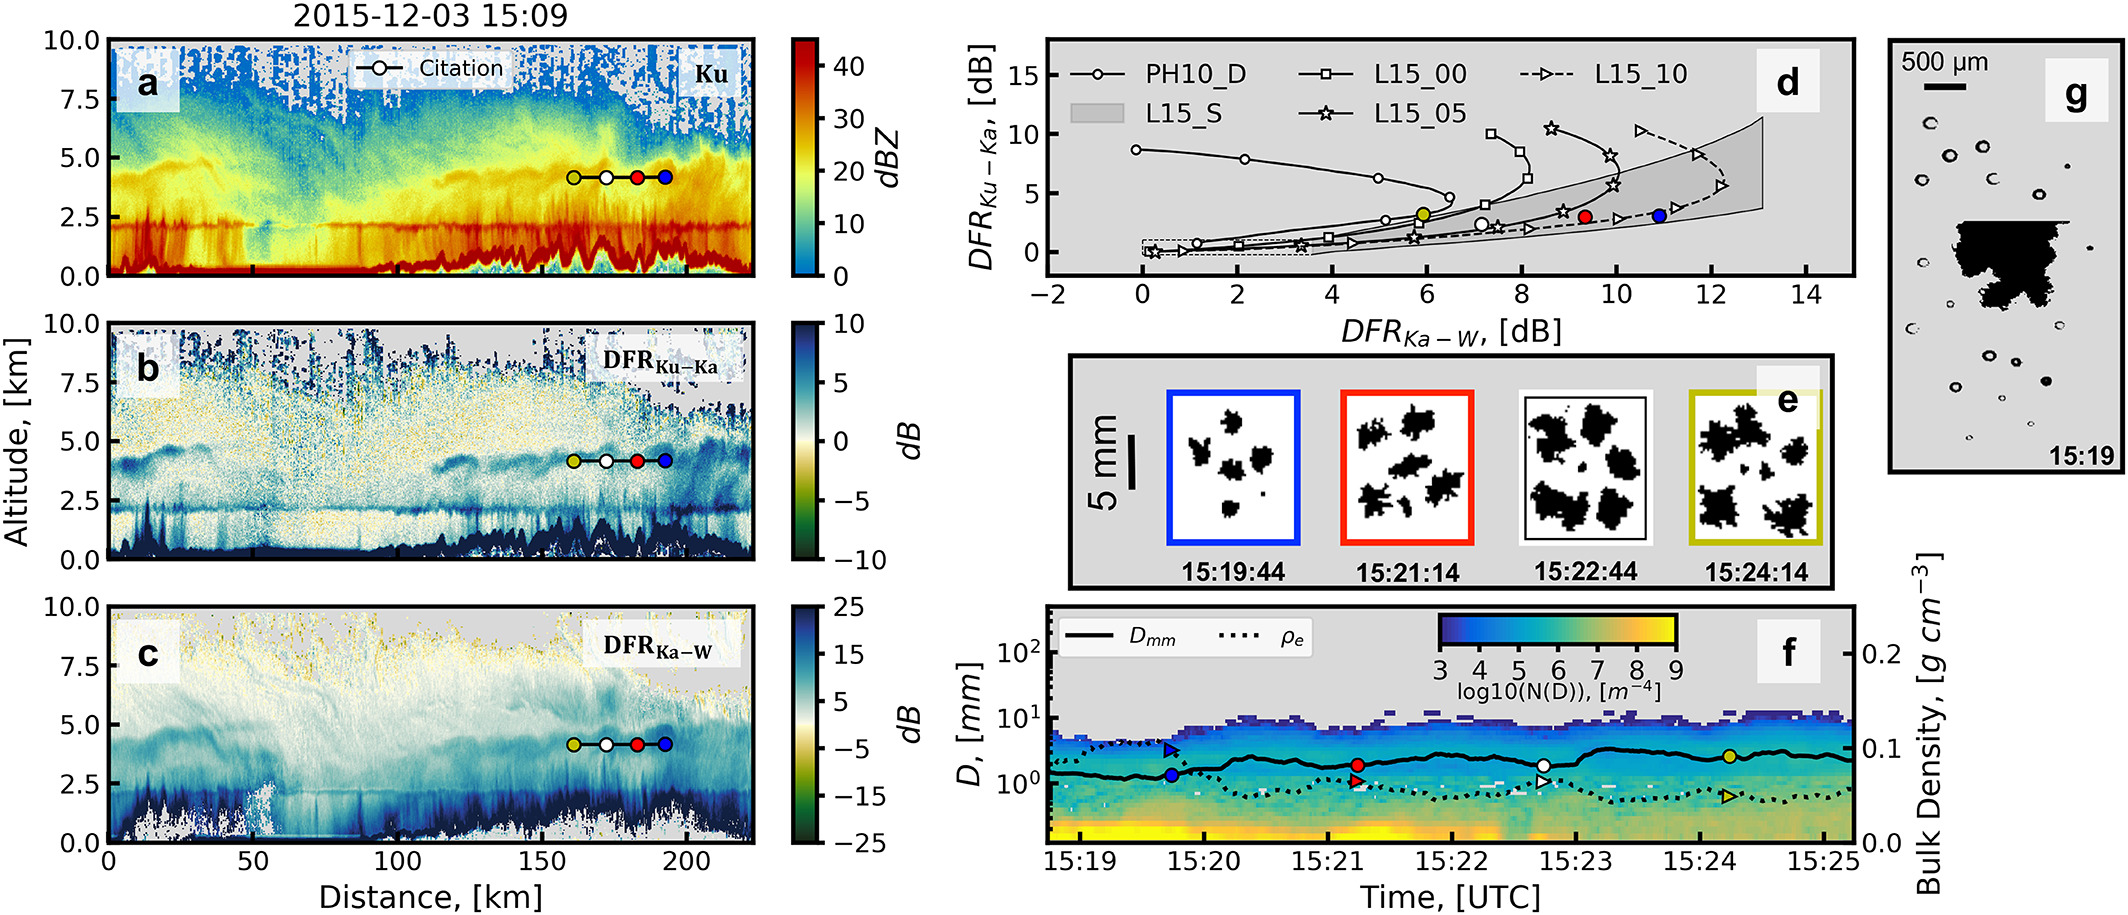 Figure 2 from my first paper showing an example of the triple-frequency obs and the in situ data
What we found in my first peer-review publication (Chase et al. 2018) that these new airborne observations compare well to the previous ground based efforts. More specifically, the dual-frequency ratio space (differences between radar frequencies) can seperate particle effective size and effective density (i.e., seperate aggregates vs graupel).
Ozone transport by storms in the Amazon (BS)
2014 - 2015
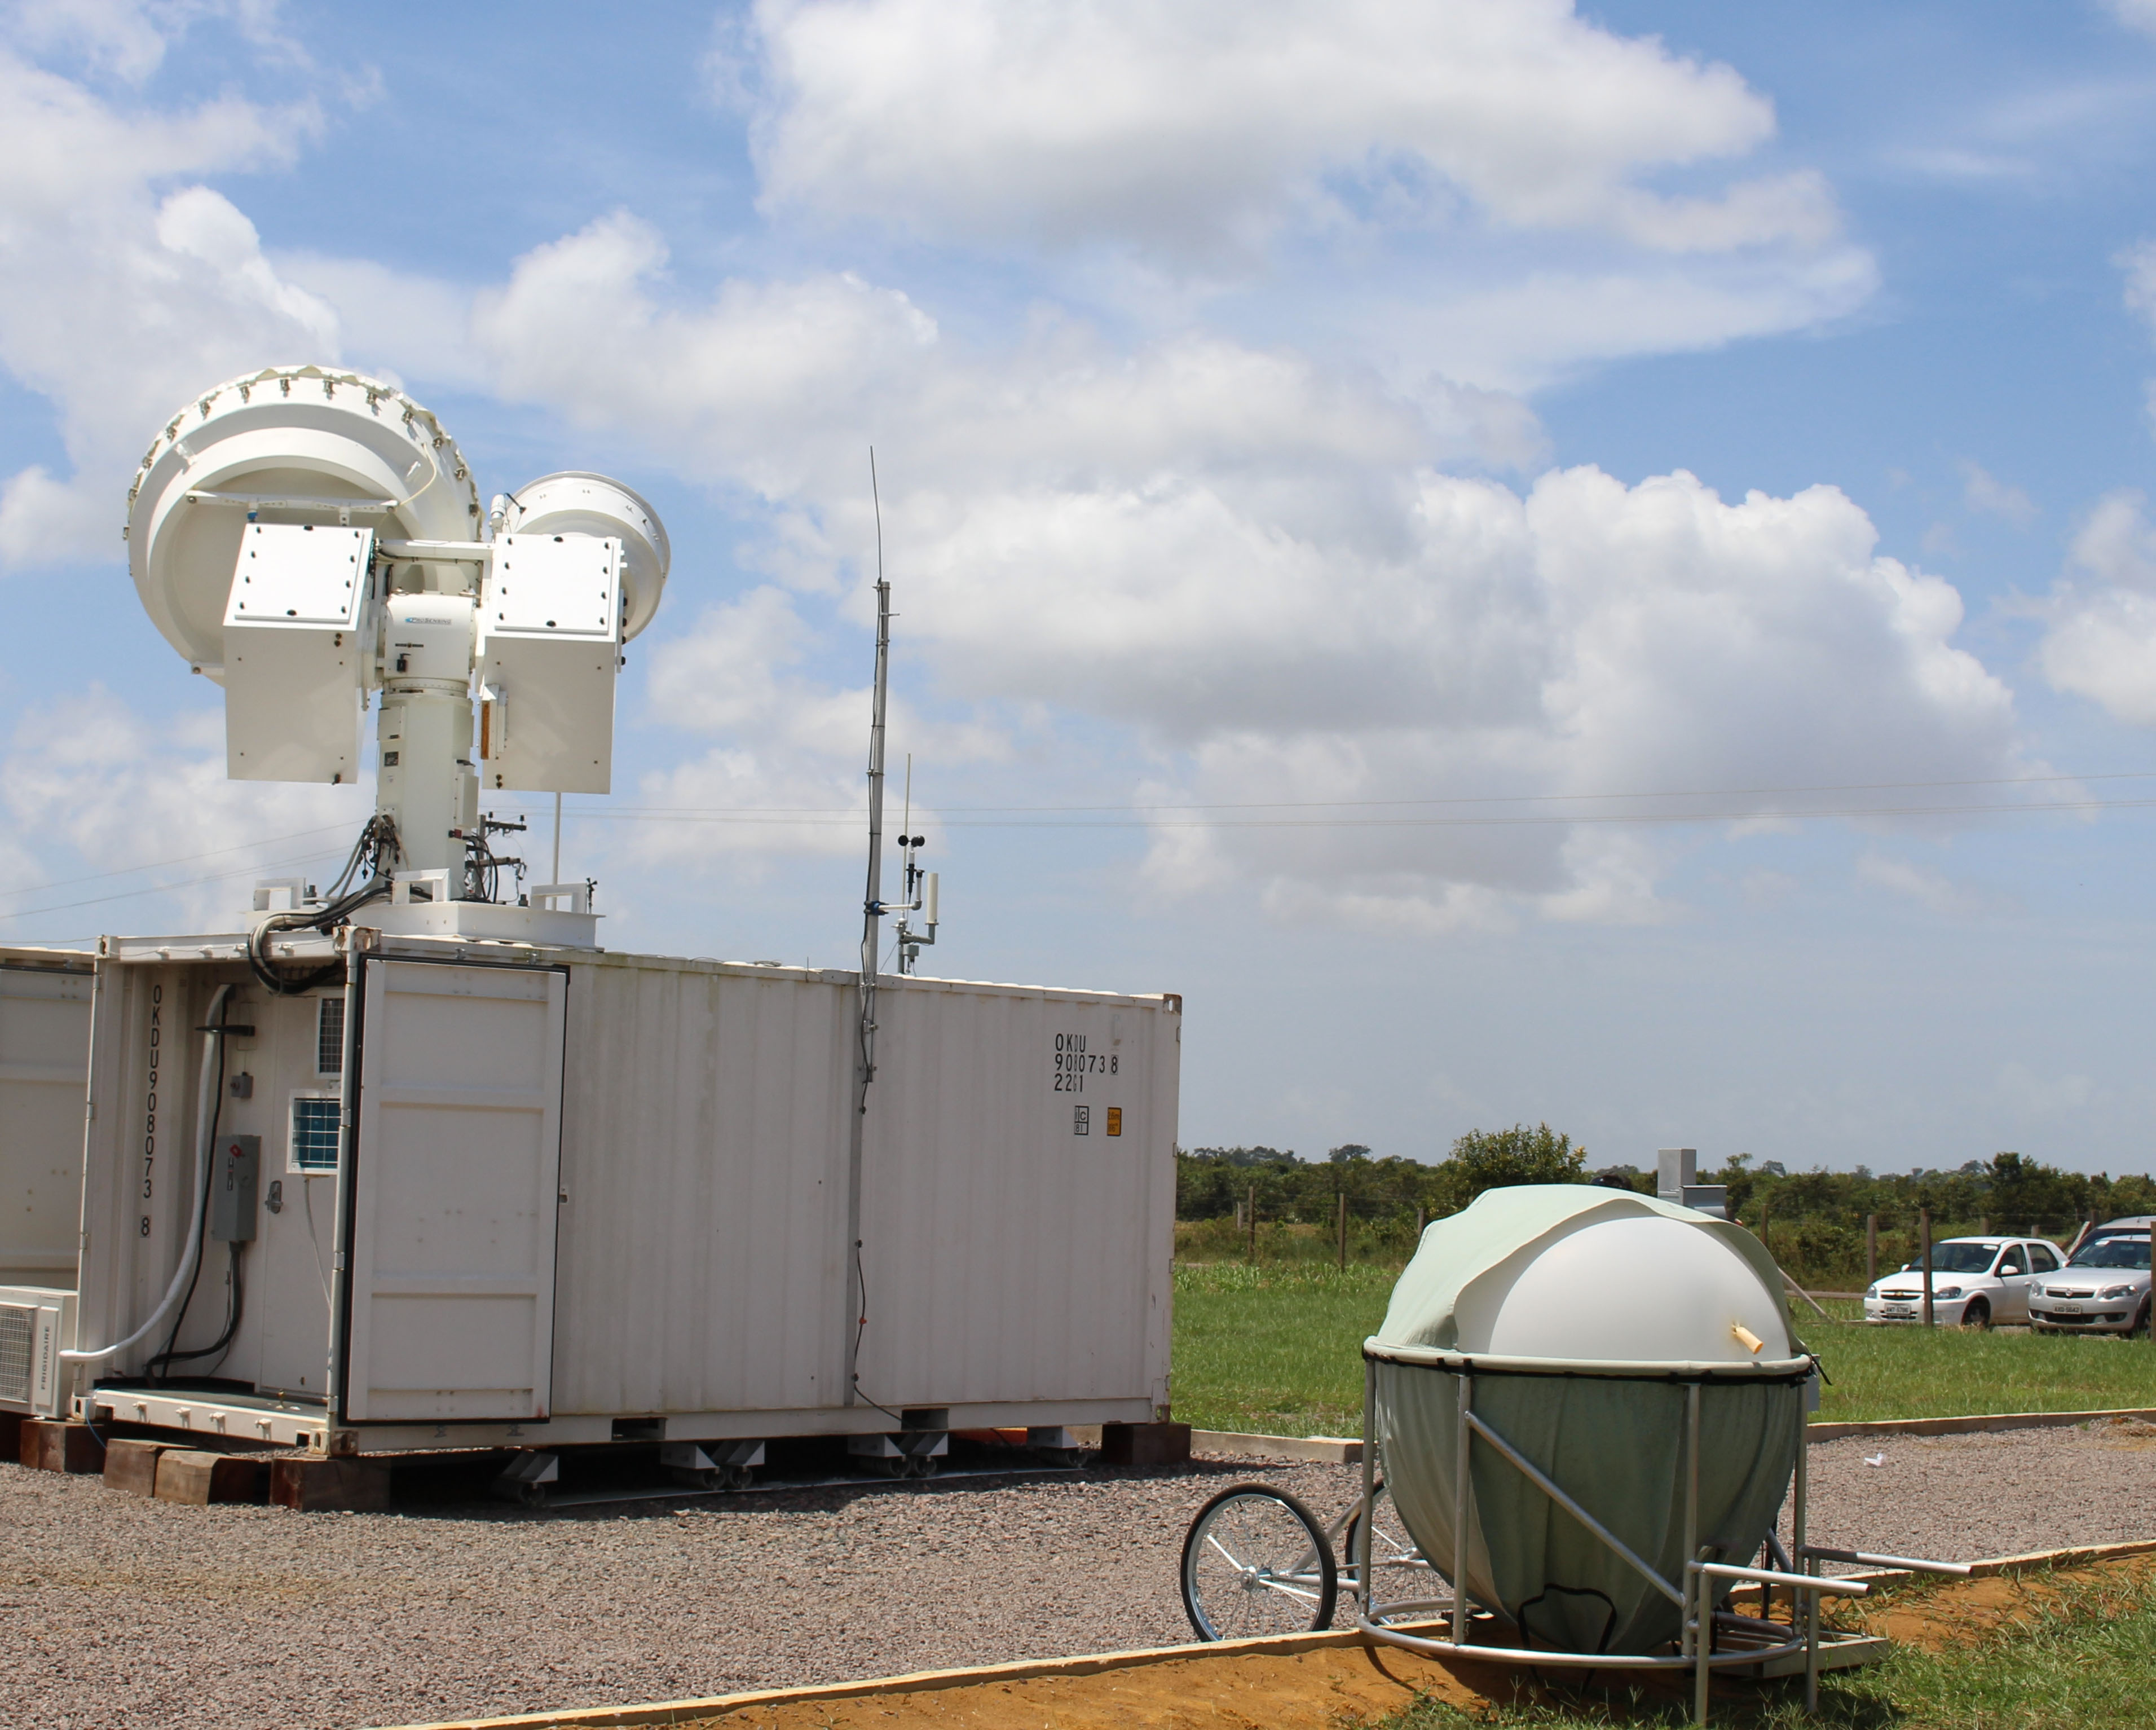 image from GO AMAZON 2014
My first topic of research was with the transport of ozone within storms over the Amazon rainforest. This was when I participated in a Research Experience for Undergraduates at Penn State University where I worked with Dr. Jose Fuentes.
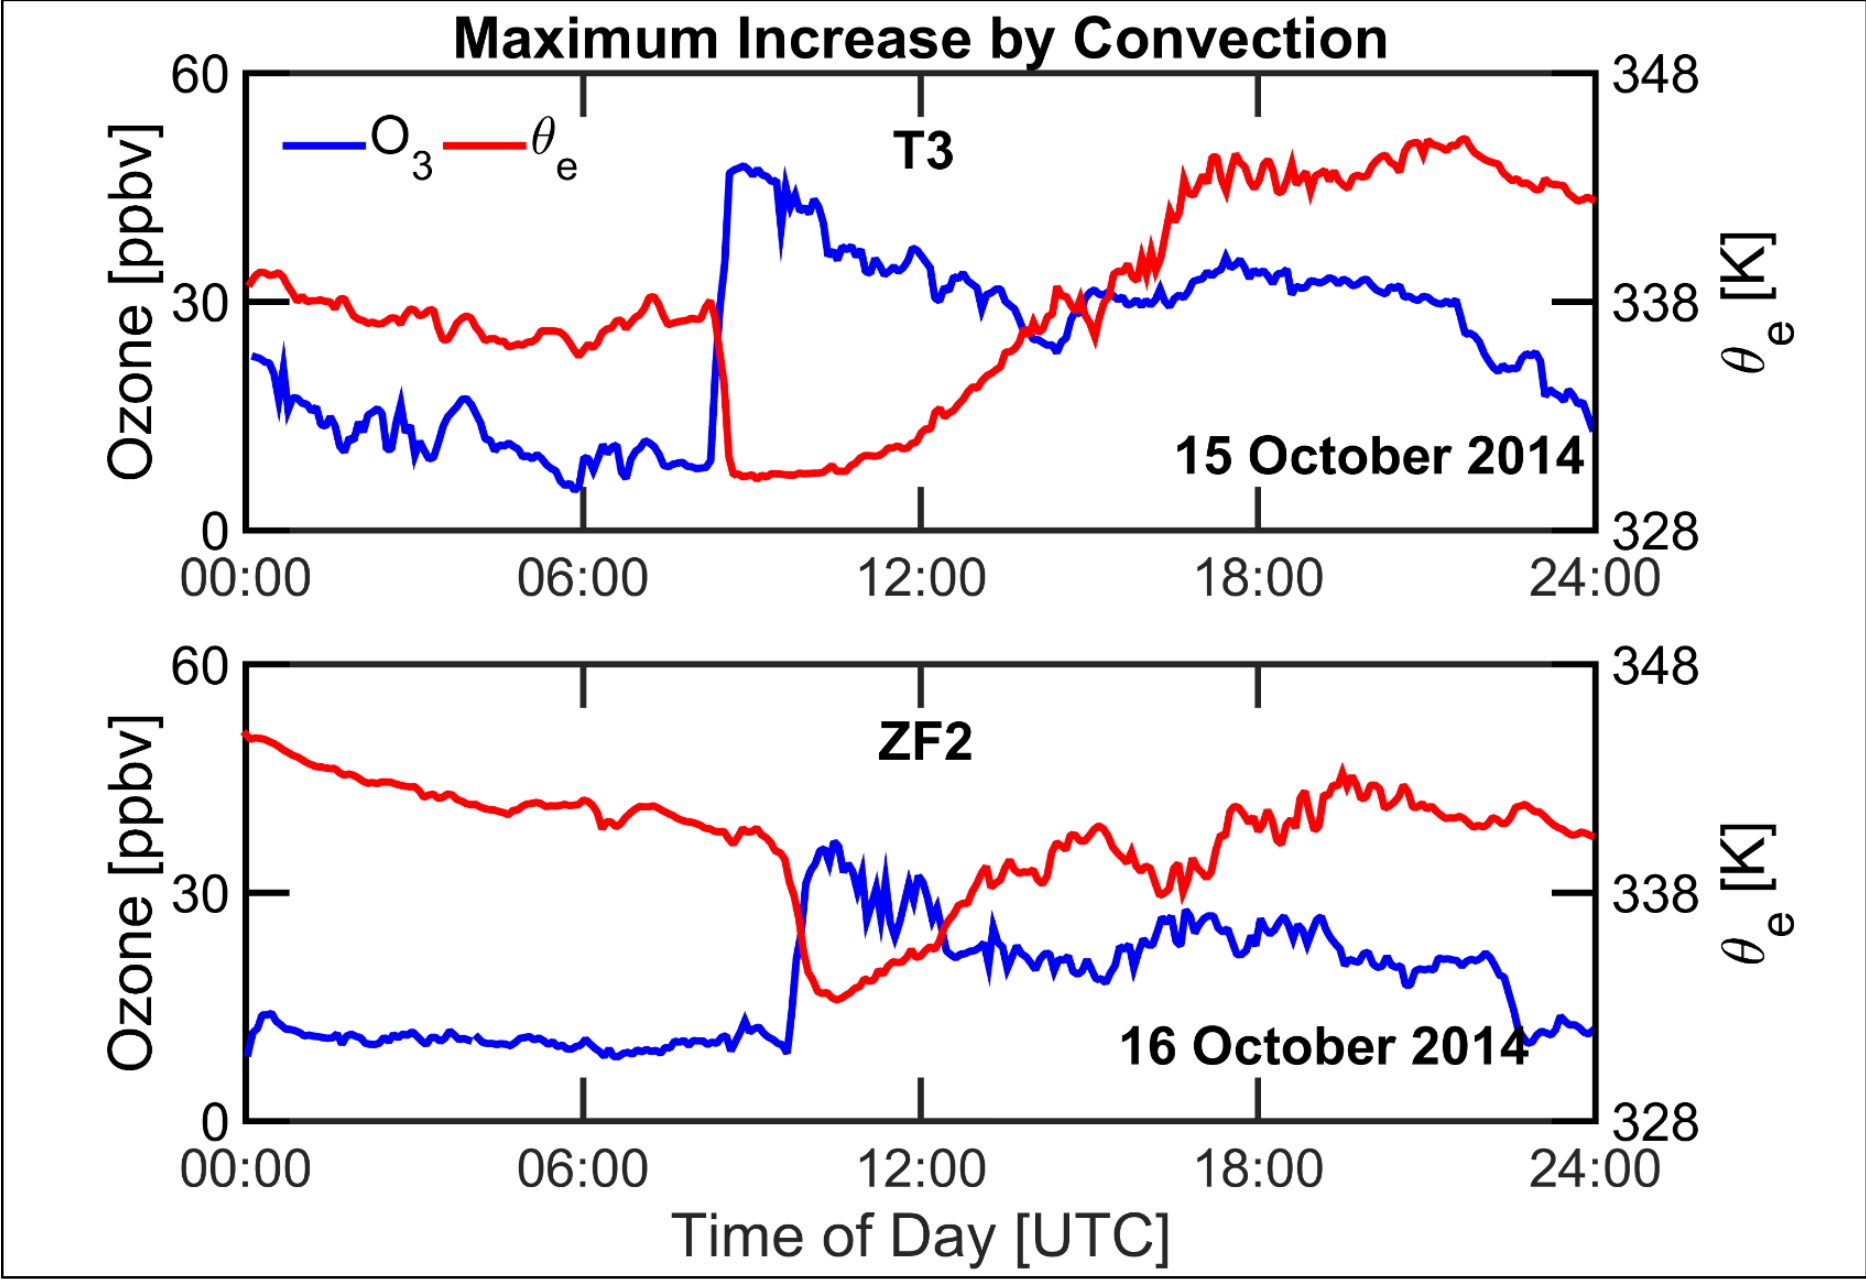
The general idea was that the rainforest is a natural sink for ozone, so ozone levels often were near 0 ppbv. When a storm forms and with it a downdraft, this downdraft would mix ozone from the free troposphere into the boundry layer. The largest example is shown in the plot above (from my poster). This example shows an increase of ozone from 10 to 50 ppbv.
This work culminated in posters at the 2014 and 2015 AMS annual meetings.